Geena 2 help page
Welcome to the help page on Geena 2, the tool for filtering, averaging, and aligning mass spectrometry data
that is brought to you by researchers from Genoa and Naples.
This system is under active development, and help pages are also developing accordingly.
Please forgive us for possible errors and send us your comments and suggestions.
What follows is a quick guide to support you in the analysis of your data with Geena 2.
Overview
Geena 2 is meant to elaborate m/z and abundance data from MALDI/TOF mass spectrometry experiments.
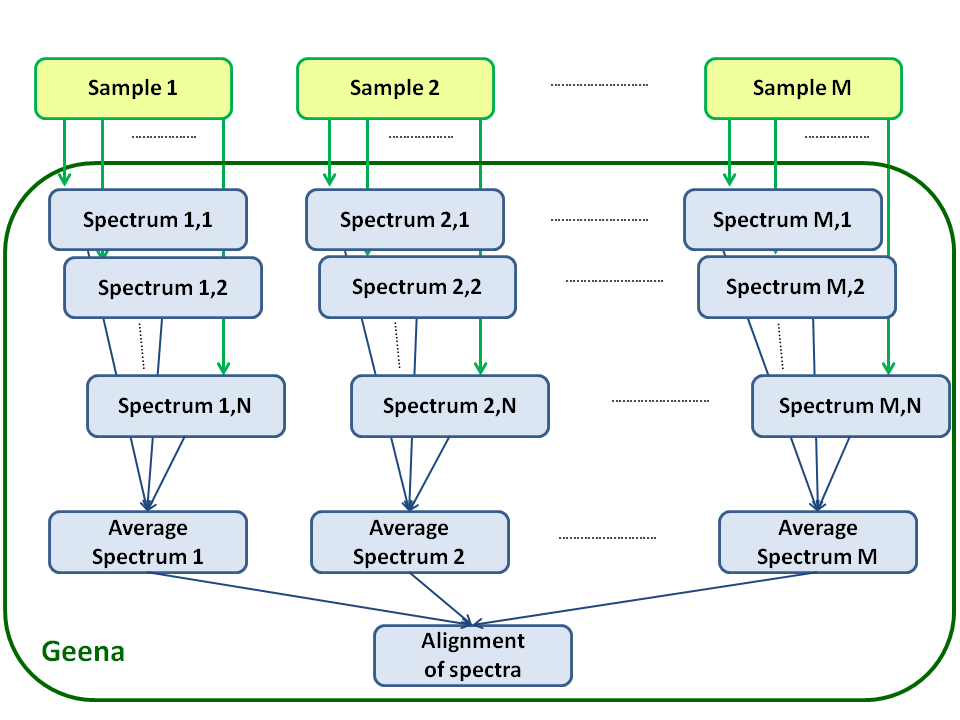
It makes the following assumptions (see also the figure):
- In each mass spectrum, molecules are present in the form of different isotopic abundances that can be summed together to give a total abundance value
- Often, experimental data have to be normalized against an internal standard in order to obtain (semi) quantitative results
- Experimental data could be affected by background noise. Sometimes, the selection of signals above a modulated abundance threshold built on the mass spectra profile may be useful
- The analysis of sample replicates yields multiple spectra which are, in principle, different only because of marginal errors/changes in the experimental phase. In order to define a spectrum representative of the sample, these spectra have to be aligned along the m/z axis and the relative abundances have to be grouped into a mean intensity value
- If you want to compare single spectra (or average spectra) obtained from different samples (for example in differential proteomics experiments) only the alignment along the m/z axis is required
For each spectrum, raw data generated by the mass spectrometer analysis software have to be exported as a .txt file; for each sample, m/z and abundances data obtained from replicates have to be arranged in adjacent columns while further spectra are separated by a line beginning with a double backslash. See the example file for explanation about the input format, and use the sample by copy&paste to try the tool.
Geena 2 allows the setting of many parameters that are shortly introduced here, grouped by type.
NB! Parameters shown in bold characters are present in the Quick Search Interface (QSI) form.
Job Information
- Job name
- Reference names for your analysis, you may change it. It is included within the name of result files.
- Default value: "Geena2_<NNNNN>" where <NNNNN> is a random integer number from "00001" to "99999".
- It can be replaced by any string. It is included in all result filenames, without spaces.
- Your email
- If you provide a valid email address, a link for downloading results will be sent by email.
- Default value: None.
- Country
- Your country, for information and statistics only.
- Default value: None.
Input Data
- Data origin
- Specify the origin of your data, either a properly formatted file (see information on file formats) or the database. For testing purposes, you may choose to download the example data file and upload it using the "Upload file" option.
- Default value: "Upload file".
- Don't change this option unless you agreed with us to have your data included in our database.
- Data file
- You MUST select a properly formatted file from your computer. This file must be uploaded to the server but it is removed as soon as it is used.
- Default value: None.
- Samples from spectra data store
- You must specify which samples should be included in the analysis: if you select All, then all samples in the database will be taken into account, if you select Some, only samples selected in the following field will be analyzed.
- Default value: "Some".
- Which samples
- You must select the samples (each including one or more spectra) from the database. This is a multiple selected field: use CTRL key + left mouse button to select single values in the list or SHIFT key + left mouse button to select a range of consecutive values in the list.
- Default value: None.
Filter and isotopic peaks join
- Analysis range
- You must define the m/z range for the analysis: all peaks outside this range won't be taken into account.
- Default values: "800" (lower limit) and "2500" (upper limit).
- You can change these values according to your needs. Use integer numbers.
- Normalization peak
- A standard signal may be added to the samples before the MS analysis for normalization aims. Select this option if your experiment included this component and you want to normalize data. You must also specify the corresponding m/z value.
- Default value: "No".
- If a normalization peak exists, select the "Yes" option AND specify the expected m/z value for the peak.
- First abundance threshold, Last abundance threshold, Intermediate thresholds' m/z and abundance values
- These parameters contribute to build by linear interpolation an abundance threshold line for the selection of significant signals. An alternative filtering method, that is based on data background estimation, is being added to Geena 2. See a summary description of the method.
- Default values: "0" (no threshold).
- Maximum number of isotopic replicas
- Maximum number of isotopic replicas considered by Geena 2.
- Default values: "5".
- Maximum delta between isotopic peaks
- Given a monoisotopic peak P having mass M, this parameter, expressed in Daltons, defines the maximum deviation from expected values for isotopic abundances (for MALDI/TOF data: M+1, M+2, M+3,.) to consider a signal as an isotopic abundance of the peak P.
- Default values: "0.05".
Computation and alignment of average spectra
- Maximum delta for aligning replicates
- This parameter defines the maximum deviation, expressed in Dalton, along the m/z axis between two signals belonging to replicates of the same sample to align them.
- Default values: "0.1".
- Minimum number of signals in replicates
- This parameter defines the minimum number of replicates that should contain a signal to include it in the average spectra.
- The minimun value, that is 1, implies that all signals will be reported in the average spectrum, even when they are present in one spectrum only.
- The maximum value, that is equal to the number of replicate spectra for each sample under analysis, implies that signals will be reported in the average spactrum only when they are reported in all replicate spectra.
- Default values: "1".
- Maximum delta for aligning average spectra
- This parameter defines the maximum deviation, expressed in Dalton, along the m/z axis between two signals (or two average values) belonging to different samples to align them.
- Default values: "0.1".
- Minimum number of signals in average spectra
- This parameter defines the minimum number of average spectra that should contain a signal to include it in the aligned results.
- The minimun value, that is 1, implies that all signals will be reported in the final alignment, even if they are reported in one average spectrum only.
- The maximum value, that is equal to the number of samples under analysis, implies that signals will be reported in the final alignment only when they are reported in all average spectra.
- Default values: "1".
- Show standard deviation
- This option determines whether the standard deviation of the mean of abundances must be shown in the final alignment.
- Default values: "No".
|
For information, get in touch with:
Paolo Romano,
IRCCS Ospedale Policlinico San Martino,
Genoa, Italy
Click here to see my email address
|
If you use Geena, please cite the following paper:
Romano P et al.
Geena 2, improved automated analysis of MALDI/TOF mass spectra.
BMC Bioinformatics 2016, 17(Suppl 4):61
PMID: 26961516; DOI: 10.1186/s12859-016-0911-2
|


|
|